Safe Simple Trading
Like me, you are looking for independent work where you can be your own boss, work when it suits you and only be accountable to yourself. Or you are looking to suppliment your day job, or even become a professional forex trader.I offer you a simple strategy, which I use every day currency trading (Forex). I am presenting my strategy to you, after a several years of trial and error. The strategy is trend following, using hidden divergence, as trigger. I offer several tweaks that give me an over 65% win rate with risk/reward of 1:2+, with a multi time frame approach. It can be traded on any time frame. All things are possible if you practice and put the work in.I don't intend to inundate you with useless talk about my personal story, I get straight to the point. I'm not going to explain how Forex works or the basics of trading, there are countless sites that already do it.I hope this will be the start of an exciting adventure for you. Follow below for more.PS: You can right click and open each chart in a new window to show it bigger.I have been trading this strategy since 2023. In the downloads section you can download an example trading plan and journal.
Risk Disclaimer & Important Information: Trading in foreign exchange (forex), cryptocurrencies, stocks, and other financial instruments involves substantial risk of loss and is not suitable for all investors. Past performance is not indicative of future results. The value of investments can fluctuate significantly, and you may lose more than your initial investment. SafeSimpleTrading does not provide personalized financial advice, and all trading decisions remain solely your responsibility. Before trading, ensure you understand the risks involved and only invest capital you can afford to lose. SafeSimpleTrading is not regulated by financial authorities in all jurisdictions; users are responsible for compliance with local laws. Our platform provides educational tools and trading capabilities but does not guarantee profits. By using SafeSimpleTrading, you acknowledge that you have read this disclaimer, understand the risks, and assume full responsibility for your trading outcomes. If you are unsure about trading or have questions about your financial situation, consult a licensed financial advisor. For full details, see our Terms of Service and Privacy Policy.
Strategy Overview
Identifying discrepancies - A divergence is a situation where the oscillator behaves differently from the price of a currency pair or asset. These descrepacies are called divergences. I prefer hidden divergences because they signify movement in the direction of the trend, unlike regular divergences which signify a trend reversal, but I use both.

The strategy I propose is simple. It is broken down into 3 main points:1. We look for divergence between price and oscillator on the current time frame (CTF).2. Use of multiple time frames. When a divergence is detected in the CTF, we use the higher time frame (HTF) to check the trend and any impediments (support/resistance).3. We use the lower time frame (LTF) to optimize entry using regular divergence and confluence. Sometimes we initiate further entries based on defined signal and if the trend is still healthy. This technique is proposed by Gerald E. Greene in his book “ Turning losing trades into winners ”.We will look at a worked example but first let me show you my chart setup.
Chart Setup
Feel free to use your favorite oscillators and colors. This is only a guidline. Keep it simple, you only need 2 oscillators. I find that using 2 oscillators agree it is a stronger signal than just one.NB: An MT4 Metatrader template has been included in the 'Downloads' section.Indicators and settings:Relative strength index (RSI) - Period 10, applied to close.Stochastic - %K period 8, Slowing 3, %D period 3.Moving average of oscillator (aka OSMA or MACD histogram) - Fast EMA 8, Slow EMA 17, MACD SMA 9, applierd to close.Moving average exponential (aka EMA) - 5, 13, 50, 200, 800 or just a 21, 50, 200 are sufficient.Basically I use the oscillators to detect divergence and the moving averages for trend direction.Note: I sometimes confirm the trend using the RSI indicator. When the RSI is above the 50% level on the current time frame and the time frame 4 to 6 periods higher AND the moving averages are in order, then it is a stronger trend. More on this later.
The Strategy
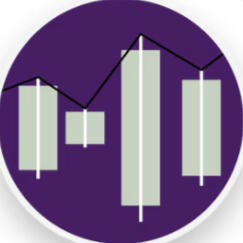
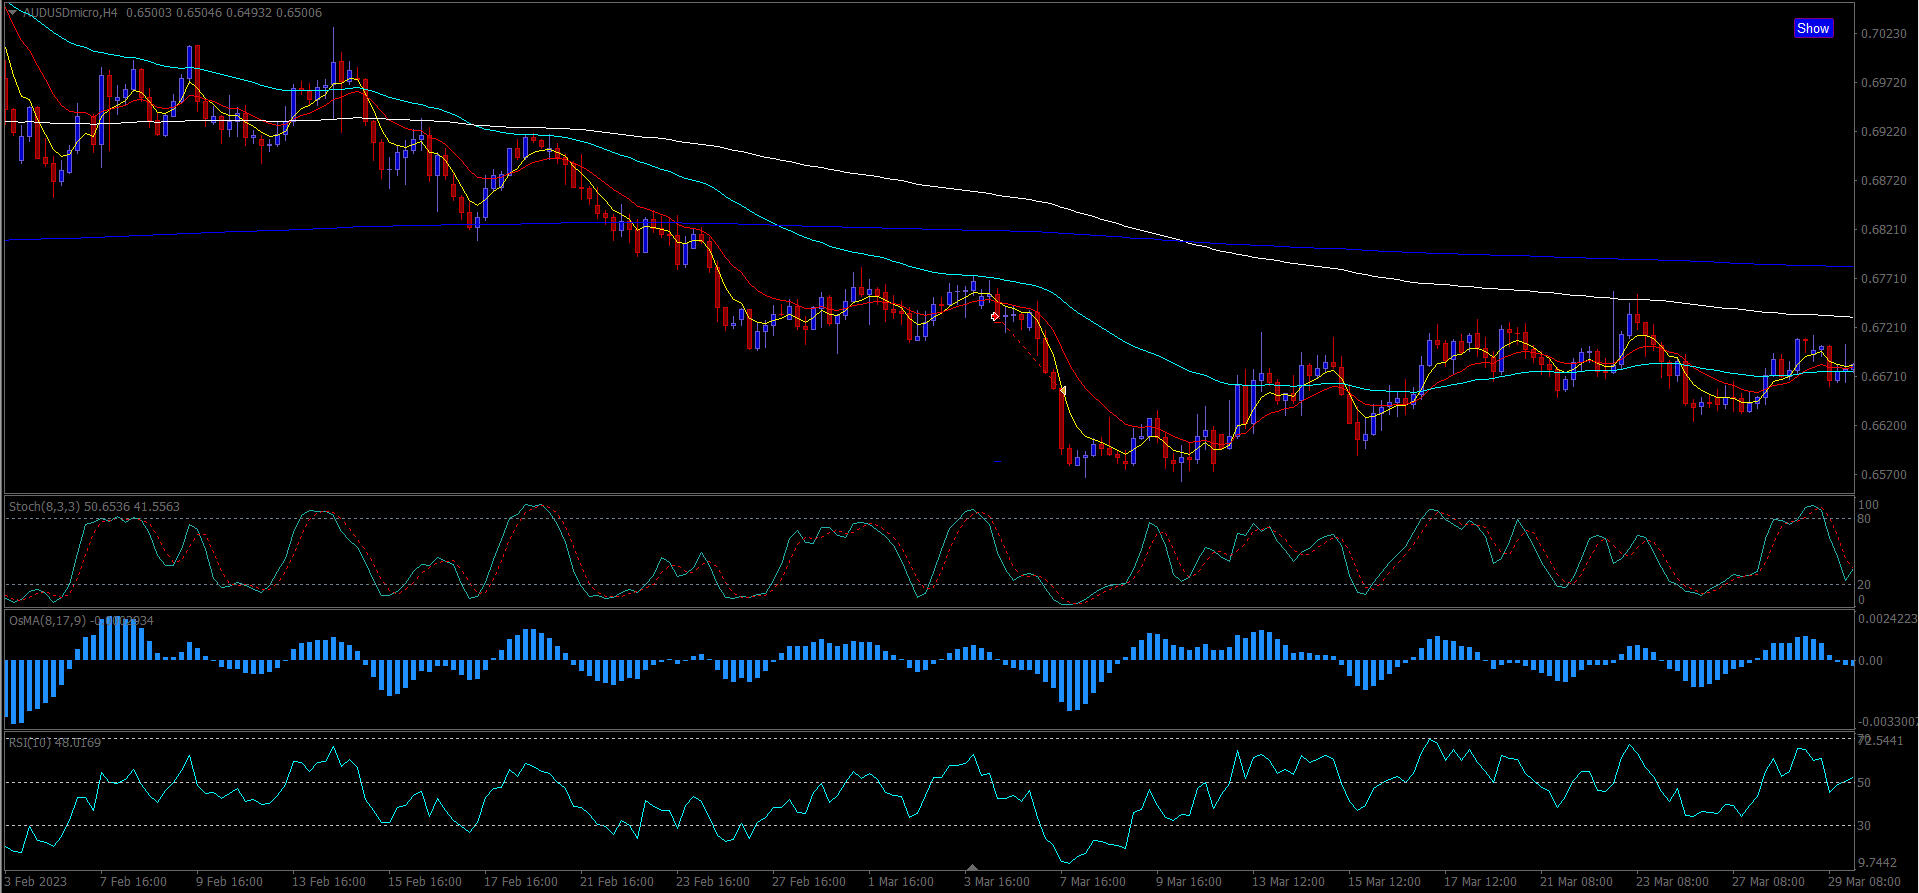
On March3, 2023 on the 4-hour time frame I saw hidden divergence. See below.There is hidden divergence on the stochasic and the RSI indicator. Price is making lower highs but the oscillator is making higher highs.
When spotted you need to see what the higher time frame is showing. Using the table below, since our current time frame is the 4-hour, you can see that record '3.' shows that our higher time frame is the Daily.
| Higher time frame | Current time frame | Lower time frame |
|---|---|---|
| 1. Monthly window | Weekly window | 4-hour window |
| 2. Weekly window | Daily window | 1-hour window |
| 3. Daily window | 4-hour window | 15-minute window |
| 4. 4 hour window | 1-hour window | 5-minute window |
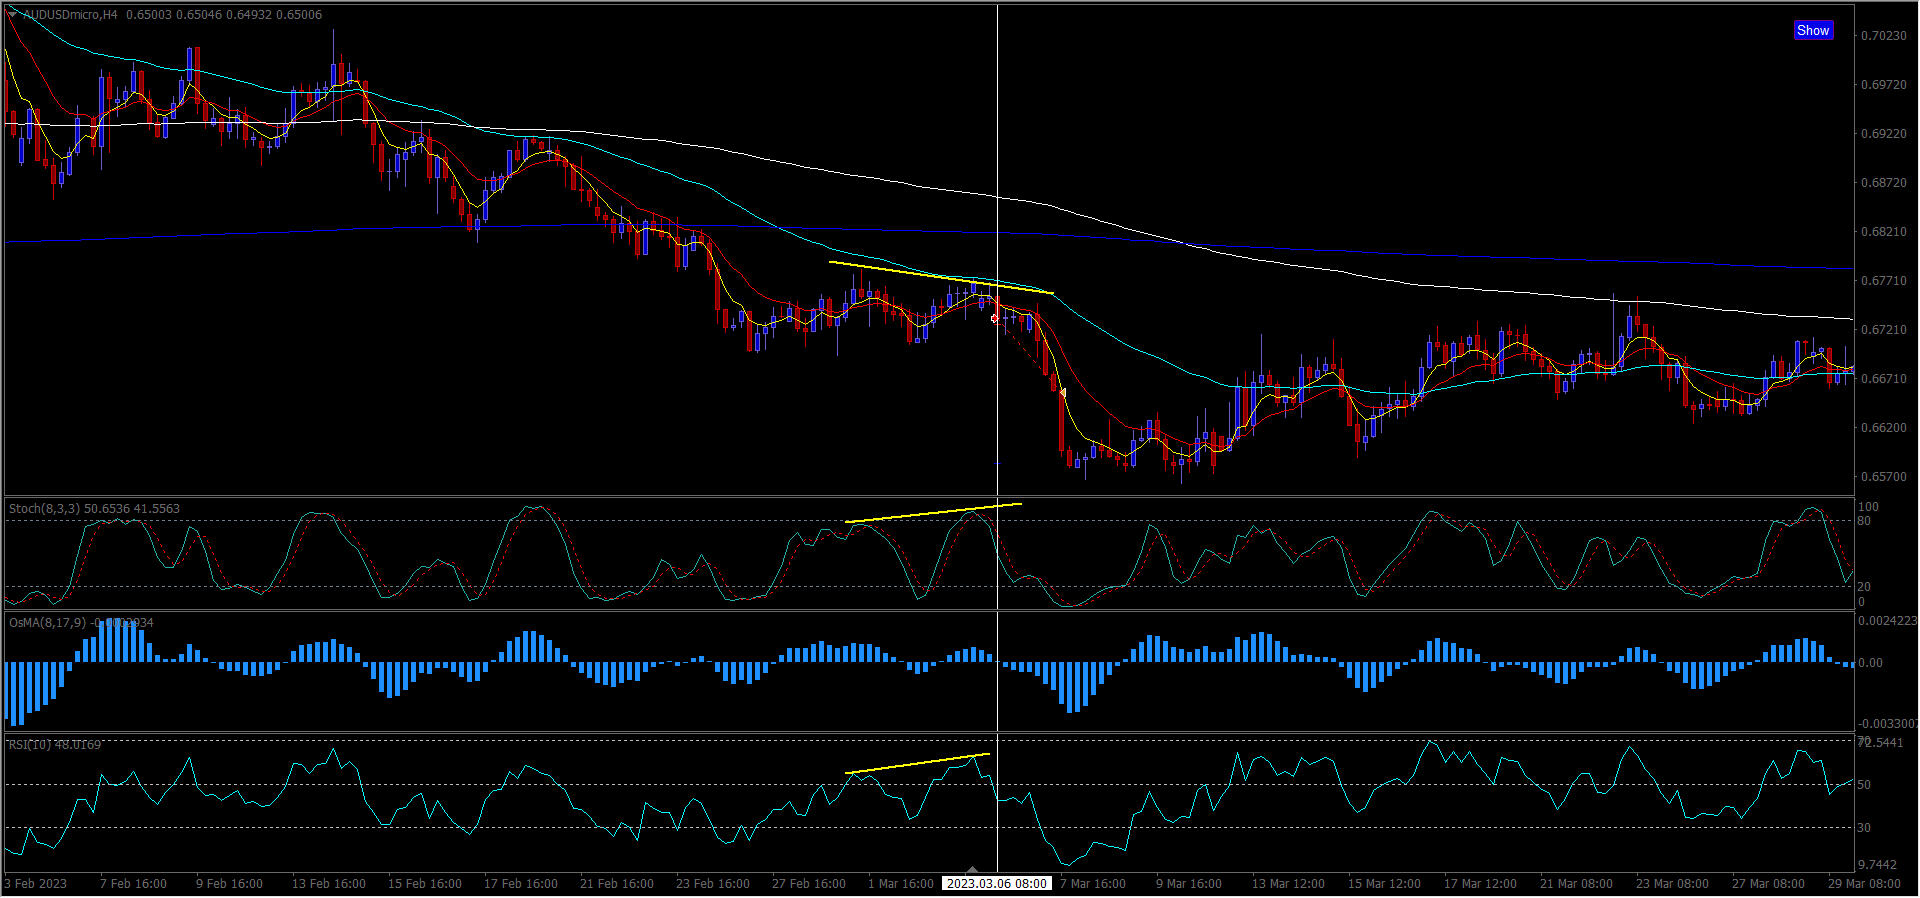
On the Daily time frame we see that the trend is down.
Why is is down, because the yellow 5 EMA has crossed the red 13EMA down and because the RSI is below 50% midline. Also the structure has changed to lower lows and lower highs and price is below all the moving averages.
So, we have a sell on the 4-hour time frame and the daily is also pointing down.
Next we turn our attention to the lower time frame to confirm and optimize our entry.On the lower time frame, I like to confirm my trades with regular divergence and a break of structure.You ofter find regular divergence on the lower time frame. I also like to look for a break of structure, which means, in a downtrend lower lows and lower highs.NB: There is a section below on entries.
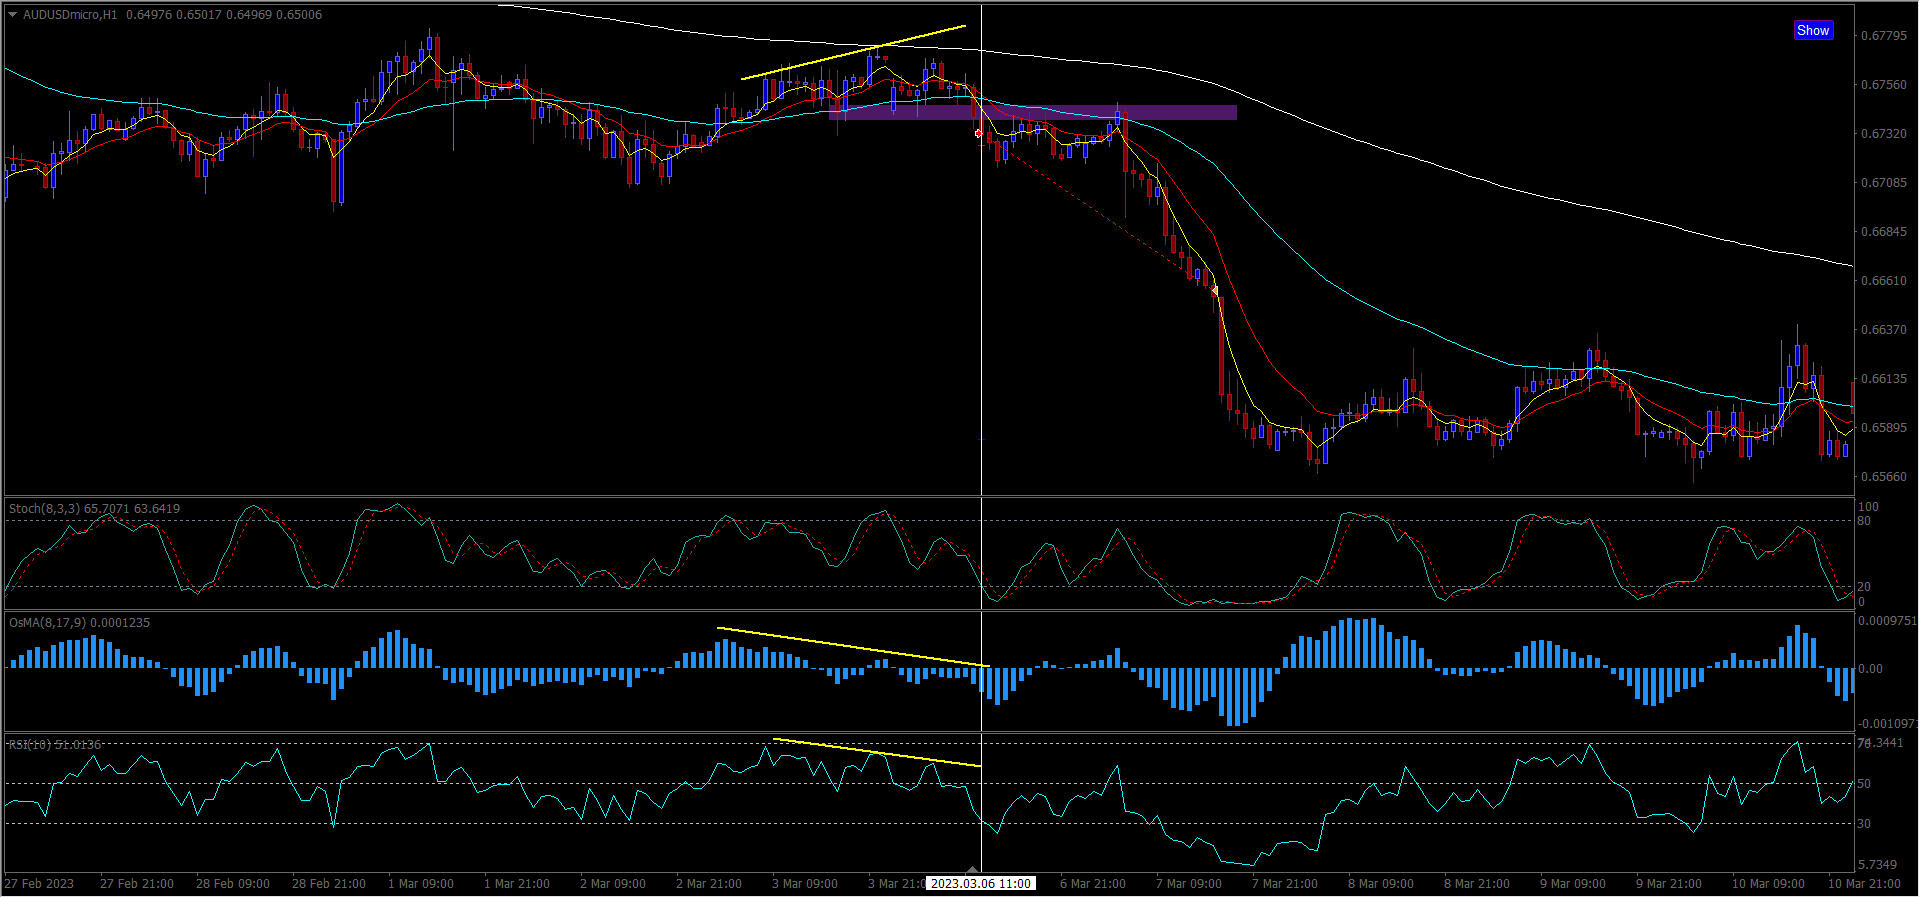
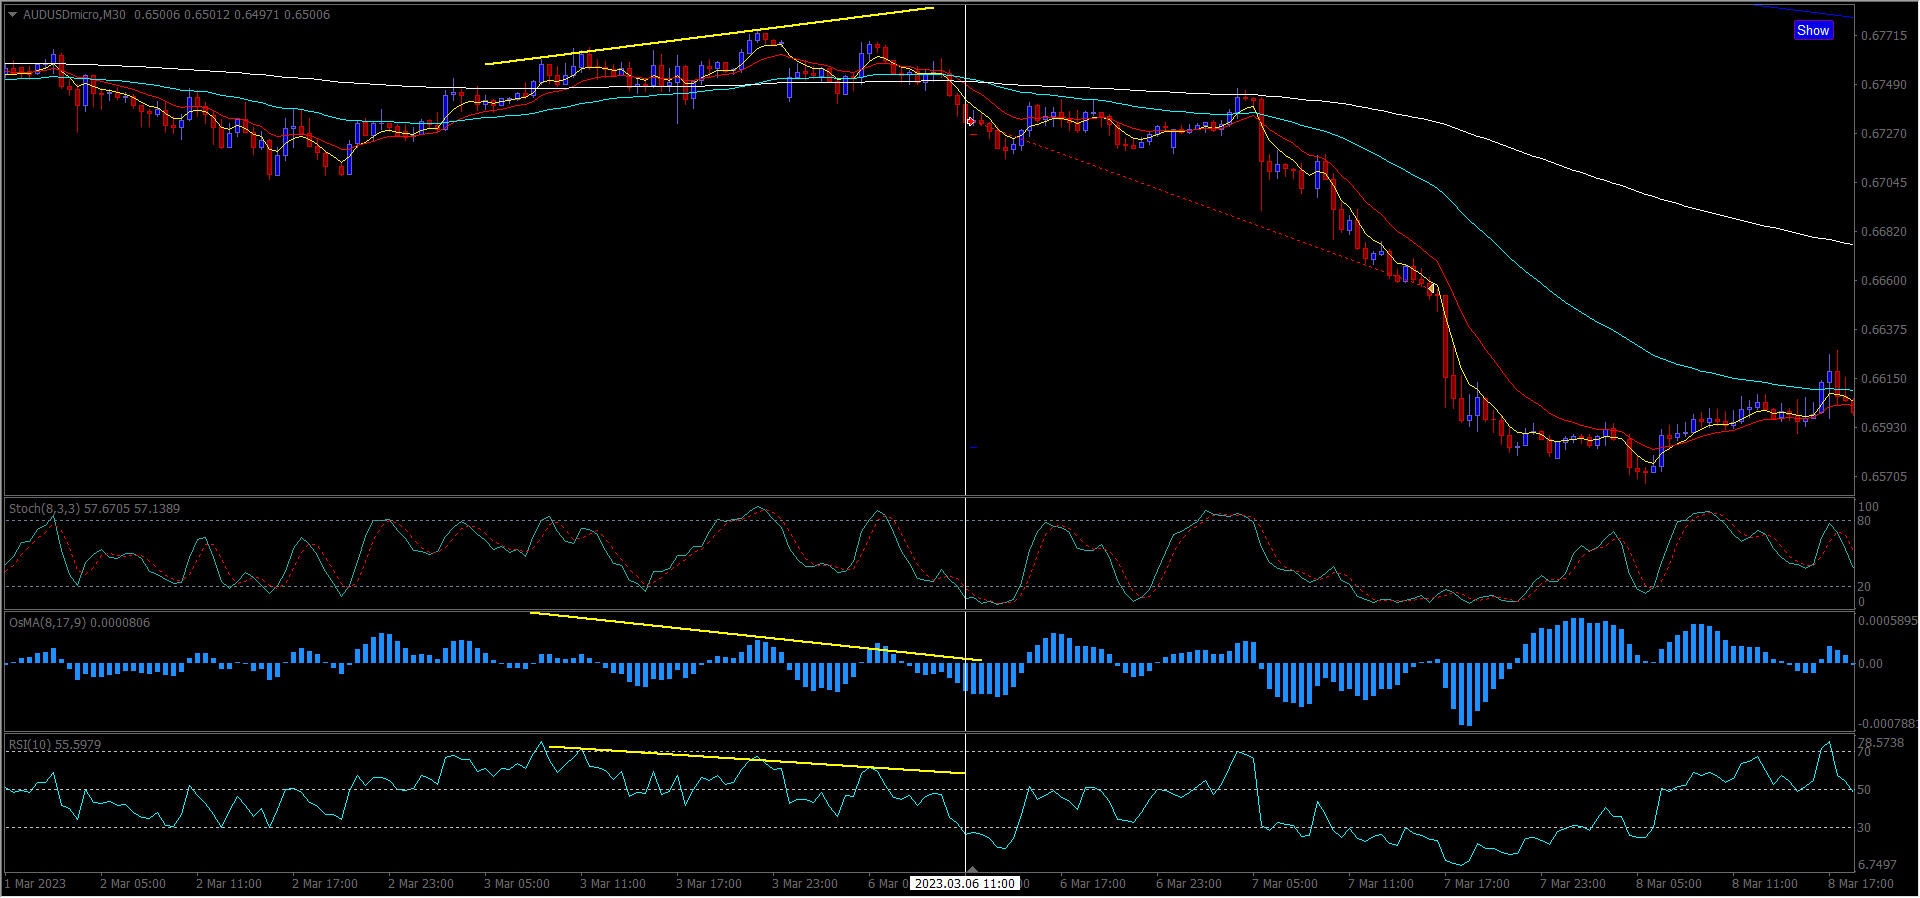
Note: Sometimes it is better to go to an even lower time frame to see hidden divergence and market structure clearer. You don't always get regular divergence until you do zoom down to a smaller time frame.See below how it is clearer on the 30 minutes time frame.
ENTRY, STOP LOSS AND TAKE PROFITS
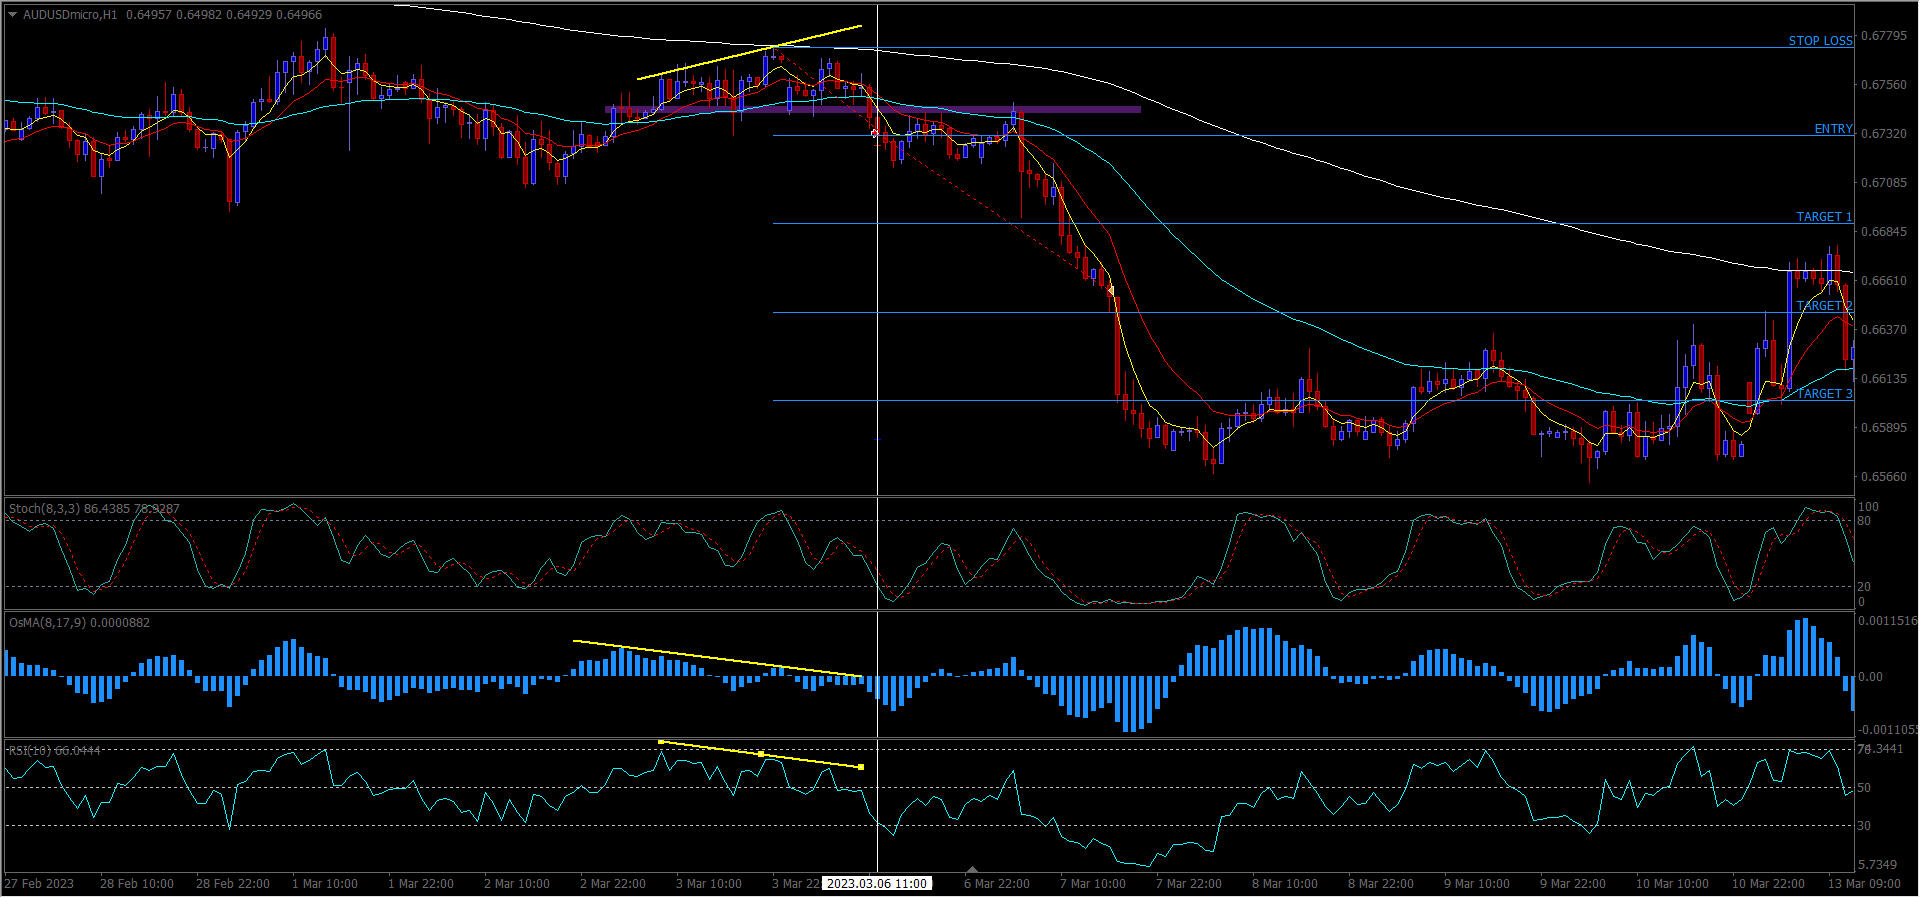
ENTRY - Once hidden divergence is identified, I like to drop down to a lower timeframe. I am looking for regular divergence on at least 2 of the oscillators. For safety, I then look for a break of structure to enter.STOP LOSS - Goes above/below the last swing point and preferably behind a moving average, or support/resistance.TARGETS - Fixed 1:2 (2 X the risk). Other ways are at next support/resistance or cross of the 5/13 EMA.See example below:
Additional entries & Fine tuning
Look for charts where the price action is clear and trending. Major assets like forex majors, bitcoin, indexes or large cap shares.Very important - you need multiple reasons to enter, the more, the better. Confluence is the key to stacking the probabilities in your favor.Confluences I look for include:-
50 EMA
Trend line break
Support/resistance
Fibonacci
Hidden divergence RSI/Stochastic/OSMA/MACD
Candle stick patterns (Bullish/Bearish engulfing, pin bar, morning star, evening star)
200 EMA
Oscillator overbought/oversold
Shark fin (TDI)The higher probability trades usually have at least 3 to 4 confluences.
Hints and tips
Most important => You only need 2 to 4 high quality/high probability trades a month to make money. If you can do that CONSISTANTLY, then it's just a question of ramping up.
Furthermore, of these 4 trades you only really need one technique/method of entry. Look for ONE pattern which you can easily recognize on the hard right of the screen. Practice it, own it, you can always add another at a later point of time. Patience is the key to making money in this business. We get paid to wait :-)
A good trend following strategy requires a trend, a trigger, and a good risk to reward (entry, stop loss and take profit combined).The 200 (EMA or SMA) is a time tested trend indicator used by almost all traders. If the price is above it is in an uptrend, take only buys, if price is beneath, it is in a downtrend, take only sells, on any time frame. The complications occur when one time frame is pointing up and another is pointing down. What is the real trend? Always ensure you are trading in the direction of the higher time frame. My strategy relies on the next higher and next lower time frame are moving in the same direction. That is when you get the highest probability of the trade going in your favor.Each time frame should be separated by a factor of 4 to 6. For example I may choose to trade 3 time frames Day, H4 and H1. There are 6X H4 periods in a daily bar and 4X H1 periods in a 4 hour bar.Mentioned in the strategy above. We need the moving averages in the correct order, hidden divergence and using a lower time frame regular divergence or some of the confluences mentioned in the previous section.The take profit should be to at least the previous low in a down trend or the previous high in an up trend. See below.
If you use a stochastic or an RSI for hidden divergence, the stongest signal is where the oscillator pulls back to the extreme of the scale.On a still lower time frame, you could enter with each reset/pull back of the oscillator, if you want to stack entries.
DOWNLOADS
MT4 Template:
https://drive.google.com/file/d/1h9PH3CfEULlZiG9NnGuDH8NdZiSJjFdT/view?usp=sharingMT4 Multi time frame RSI:
https://drive.google.com/file/d/1mDHDBPXRqH7y2cfJs5LNQKbx9iinPSU7/view?usp=sharingStrategy A template:
https://drive.google.com/file/d/1Kq0iBHzsvDQGYrm7JXSBSJzu3Q7g7y5h/view?usp=sharingTrading Plan:
https://docs.google.com/document/d/1Ei0cbn8t9dhbdej3afxcaAQAxduco6V/edit?usp=drivelink&ouid=105253618270299790426&rtpof=true&sd=trueTrading Journal:
https://docs.google.com/document/d/1GJzIOzWp6E8u3mJvX8RGwCAB3j-i-AA-/edit?usp=drive_link&ouid=105253618270299790426&rtpof=true&sd=true
Money Management
This topic is perhaps the most important in the field of trading. It is said that it is not where you enter the trade but how you manage it that is of importance. Having a solid trading plan and following it is crucial.There are several ways to manage a trade, but I offer you one that is simple. Here are the main points:1) Always use a stop loss. When you are about to buy or sell, locate the spot on the chart that will close the trade if the price does not move in the direction you want. Generally I use the level of the last swing. It is called "resistance" when the trend is downward and "support" when it is upward.The distance between the buy level and the stop loss gives the amount of pips you are willing to lose if the price does not go in the expected direction. Aim for a gain equal to or greater than your risk. At least twice times the stop distance or more.If I take 10 trades and 5 win and 5 lose, with a 1:2 risk to reward:
Lose trades 5 X 1 = -5
Win trades 5X 2 = 10
Therefore I am profitable with a profit of +5.2) Never risk more than 2% of your account. If you do this, it will be more difficult to make up for your losses with less capital. If your risk is less than 2%, you can increase the number of trades you take until you reach 2%. If you exceed 2%, decrease the number of lots accordingly. If you are already using the minimum number of lots allowed and the risk exceeds 2%, do not take the trade. There will be many other opportunities that will present themselves.To calculate your lot size always use a lot size calculator like:
https://www.babypips.com/tools/position-size-calculator
or
https://www.myfxbook.com/forex-calculators/position-size
CONTACT DETAILS
E-Mail:
[email protected]Website:
safesimpletrading.com
© 2022-TODATE
Add-on Strategies
Some really good additional trade entries I am trading on separate accounts. Win rate 65+% with 1:2 Risk:Reward. All of these are trading with the trend, why swim upstream? As stated previously, you need a quantifiable trend, a trigger and a good risk to reward (stop loss/take profit). Up to you what suits your personality. Just make it your own, own it, let it be your ONE entry technique until mastered.
Add-on A:
Time frame H4 (4 hour)
20/50/200 EMA
Stochastic 8/3/3
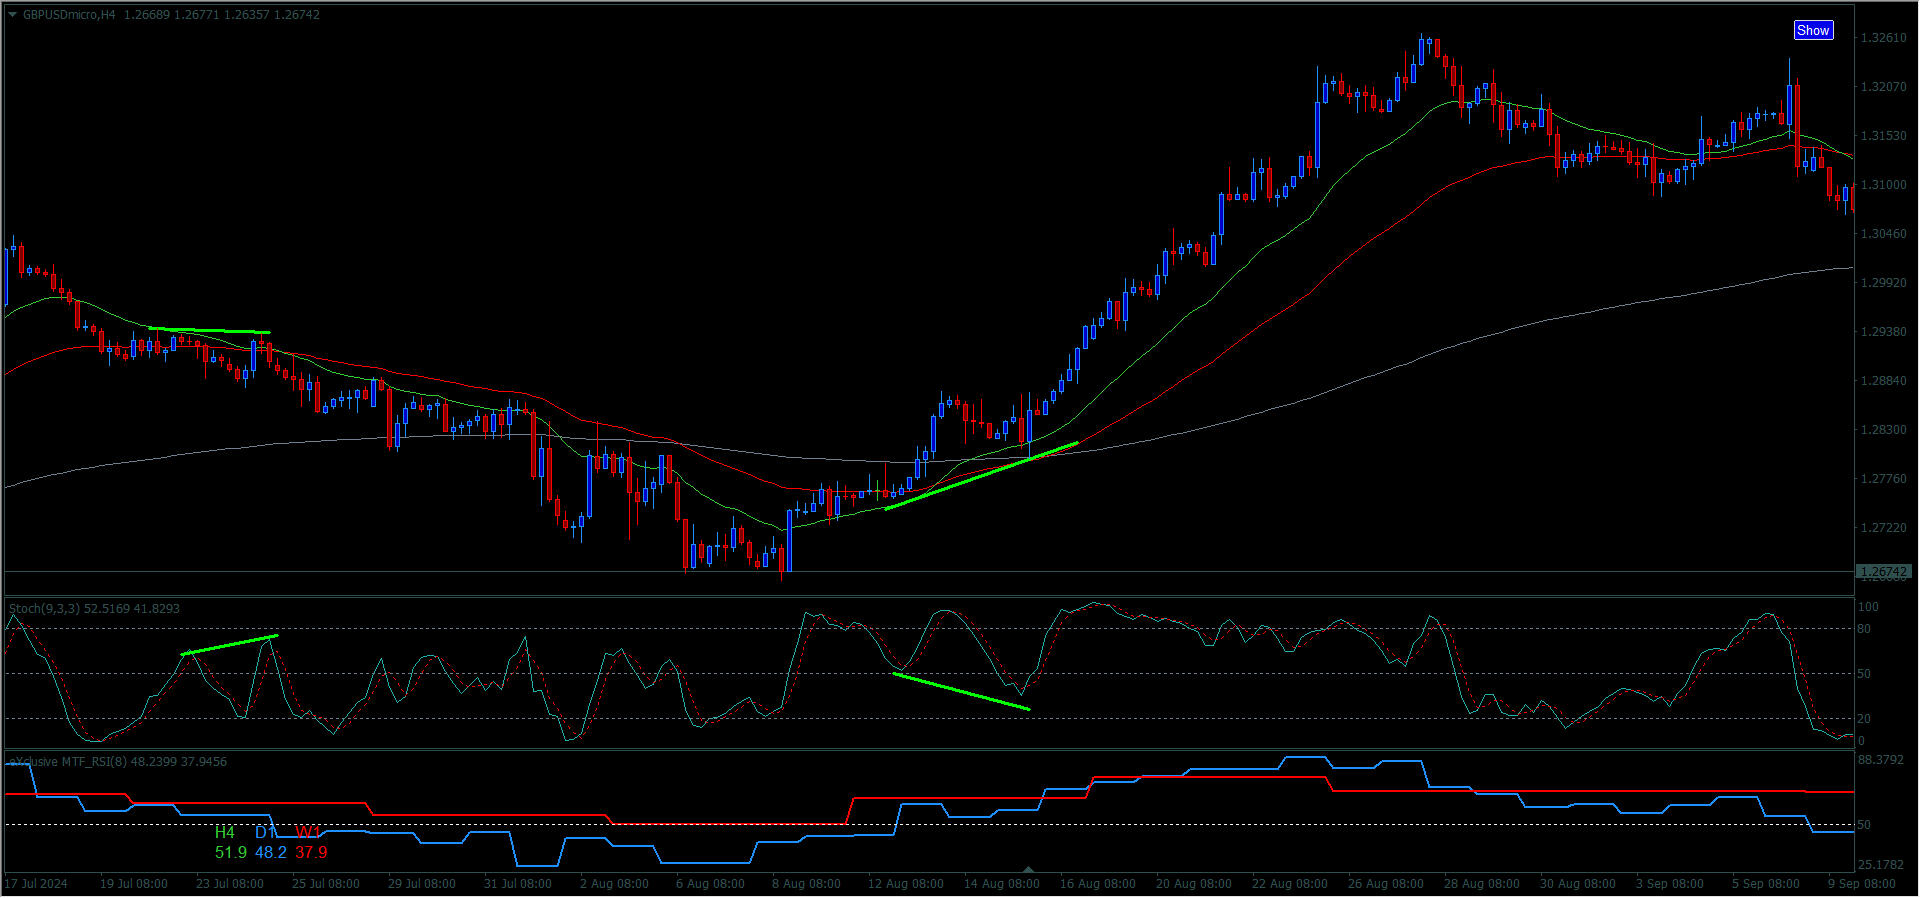
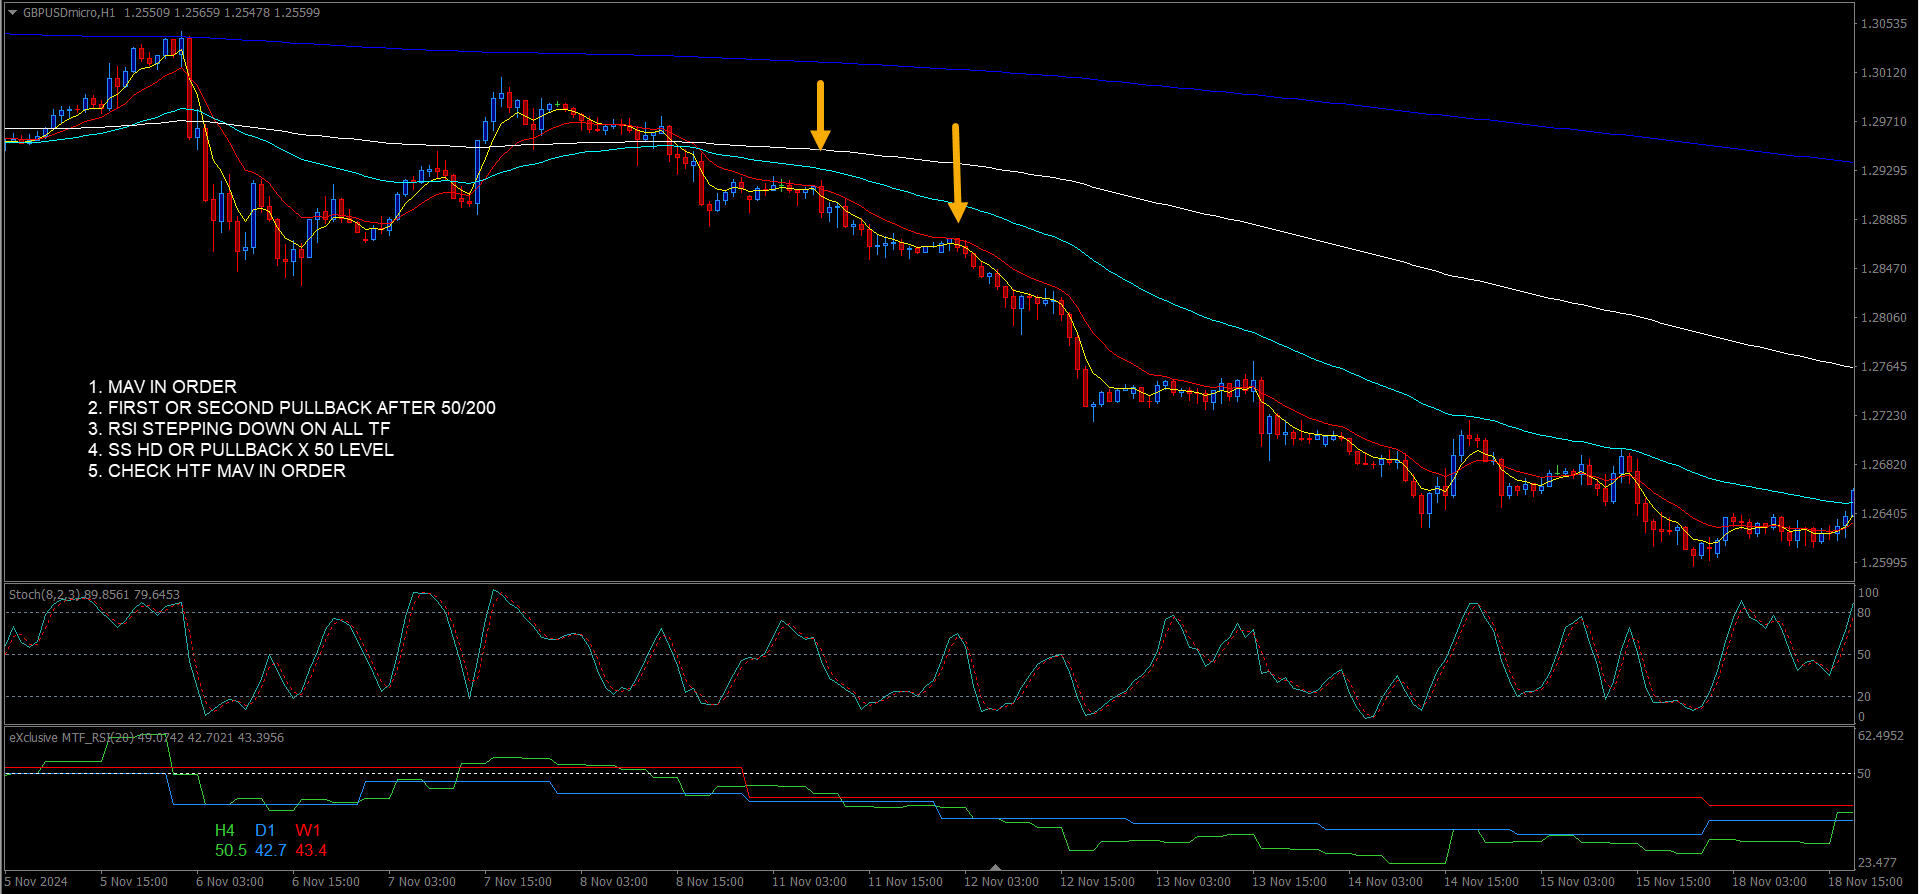
Multi time frame RSI with period 8, Daily and Weekly (See 'Downloads').On the H4 time frame, wait for cross over of the 20/50 above/below the 200. Then take the first or second pullback of the stochastic which crosses the 50%. This is especially good if you have hidden divergence as shown below but also without. Moving averages in order and the multi time frame RSI must be above the 50% for a buy or below for a sell.Check one time frame higher if the moving averages are in order. Check one time frame lower if there is regular divergence, then better and and the moving averages are also in order.
Example of a buy.
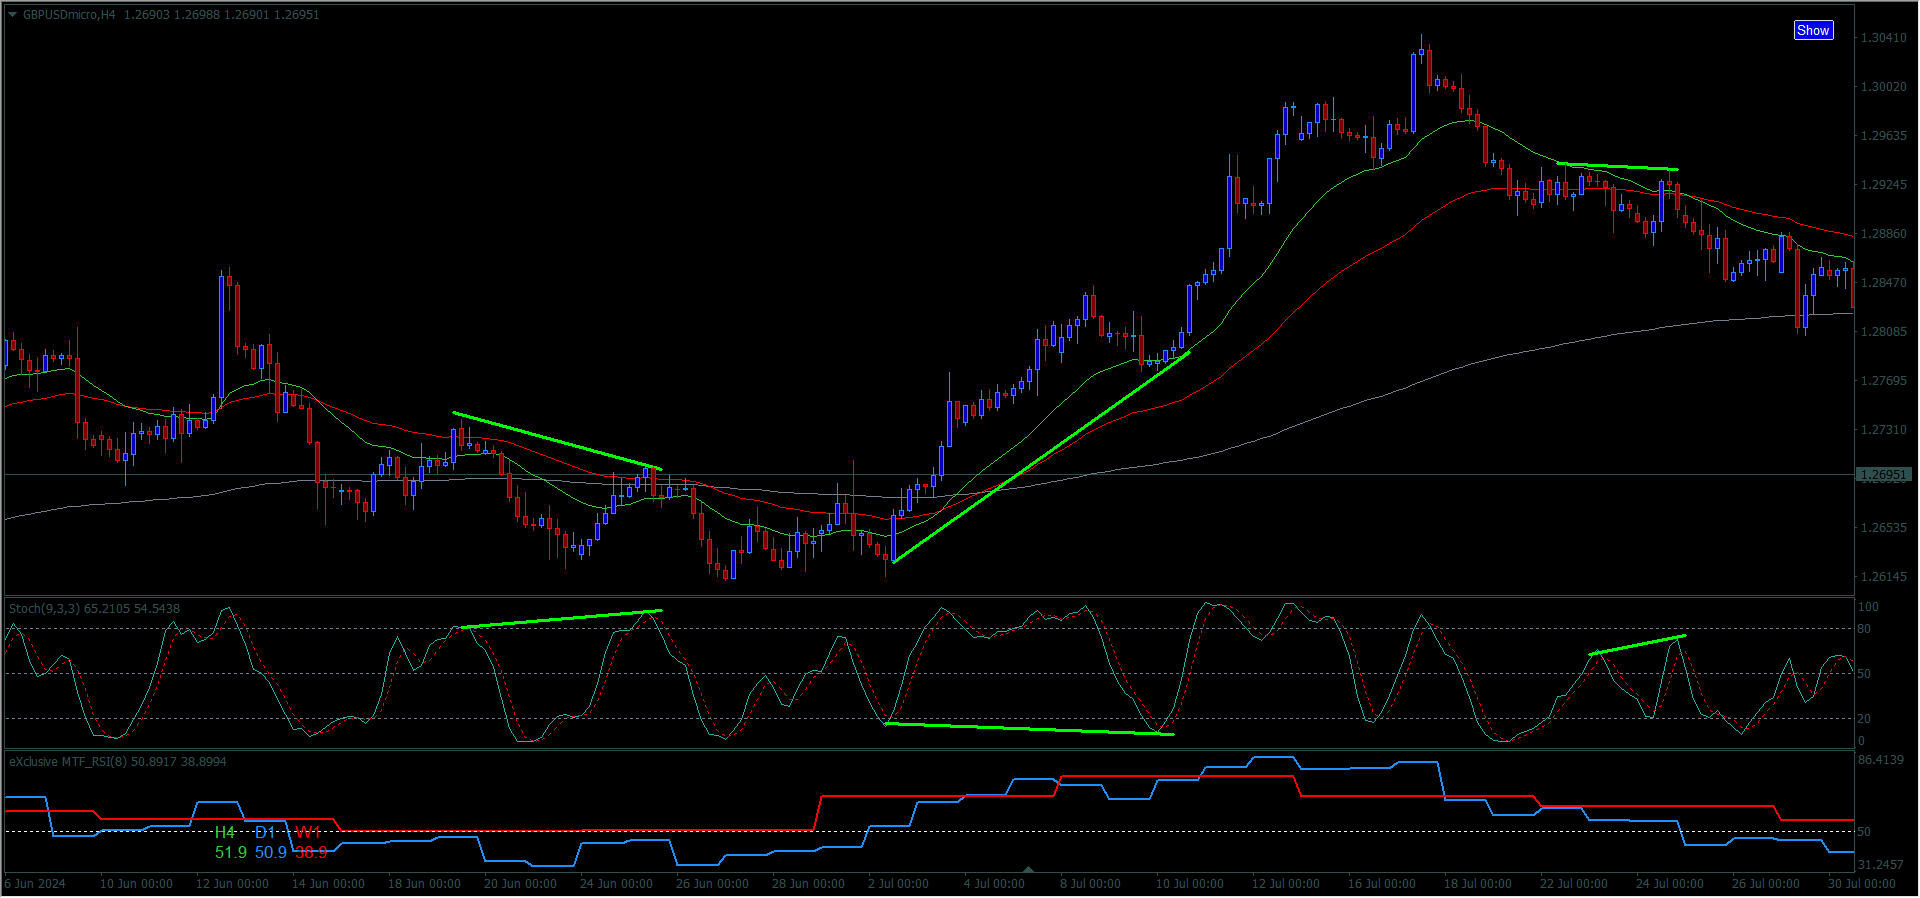
Example of a sell.
Add-on B:
Time frame H4 (4 hour)
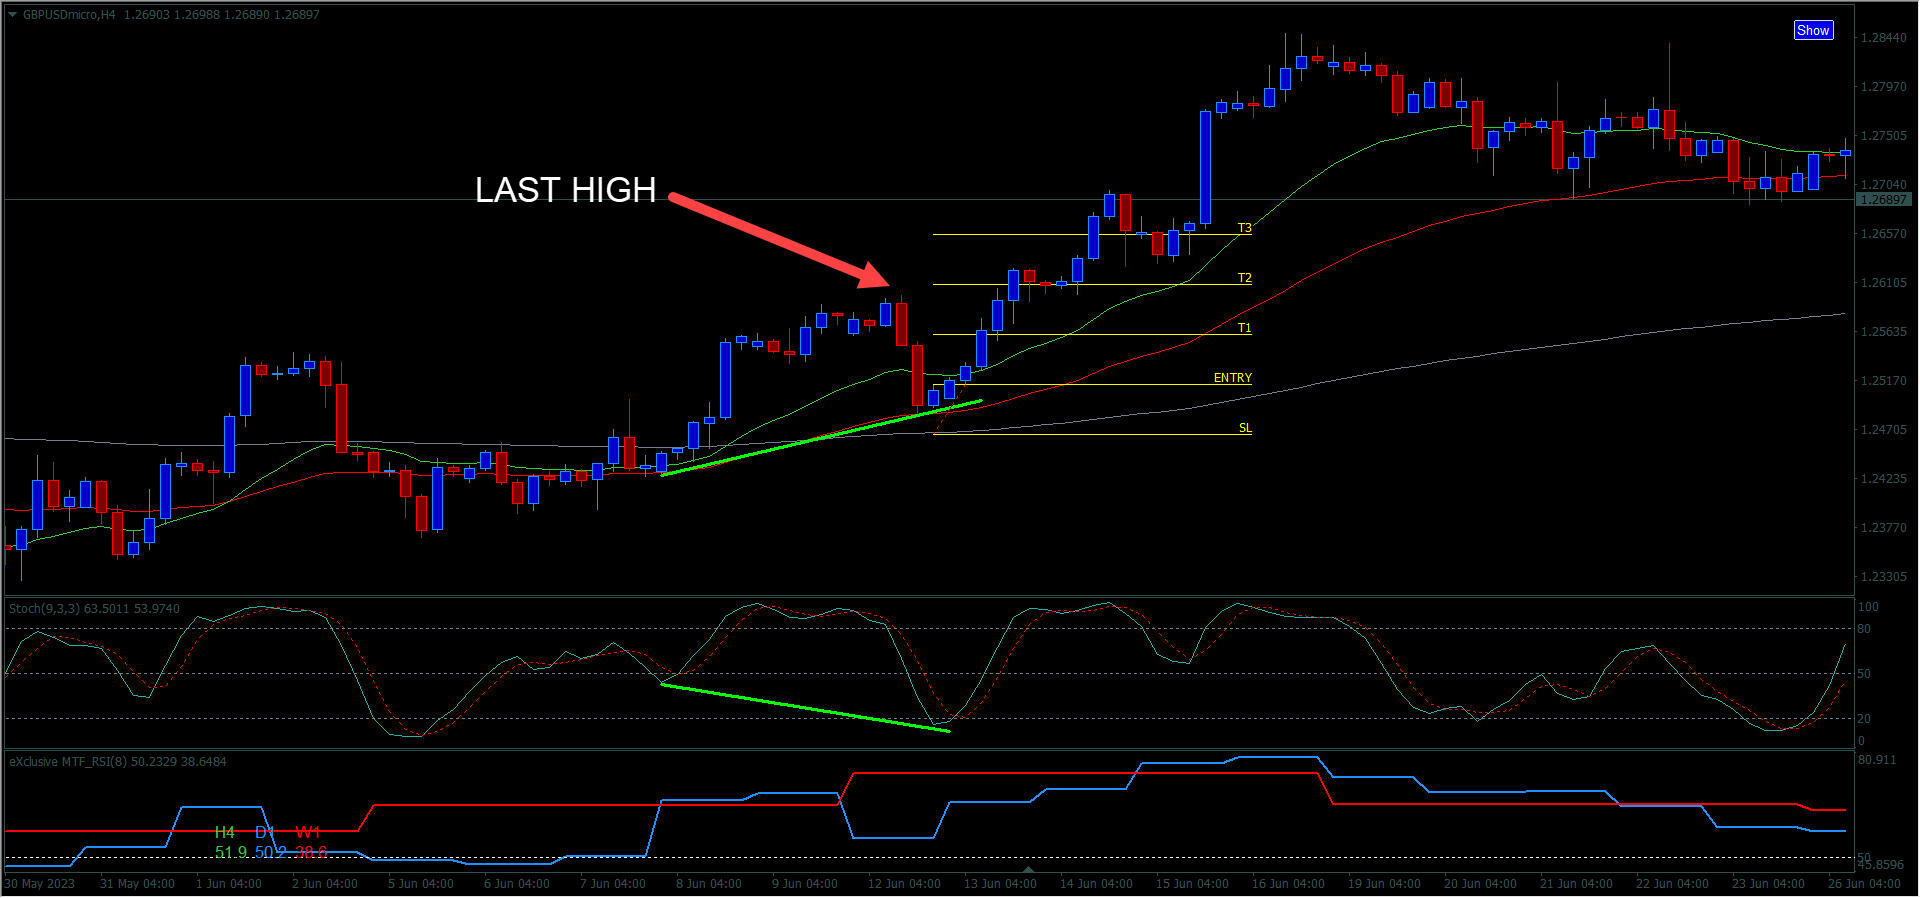
Break and retest of support/resistance.I am always looking for a break and retest of a previous swing high or low and anticipating retest. Eample in the screenshot below.
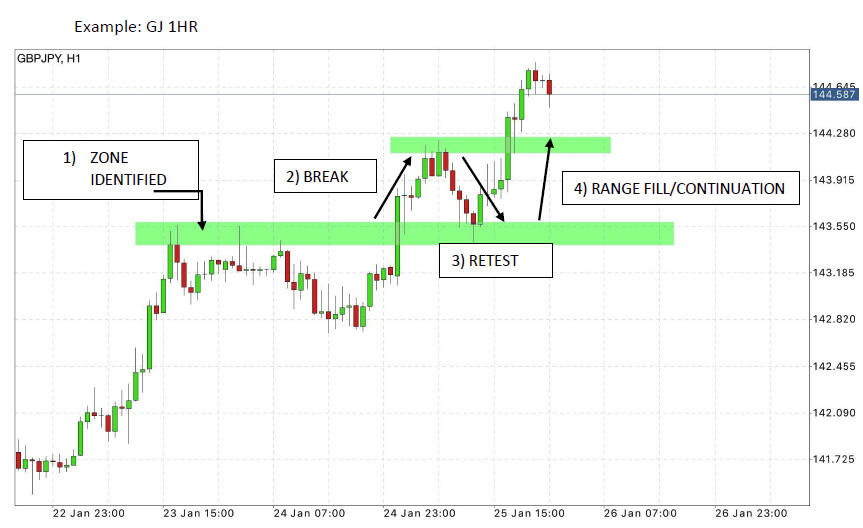
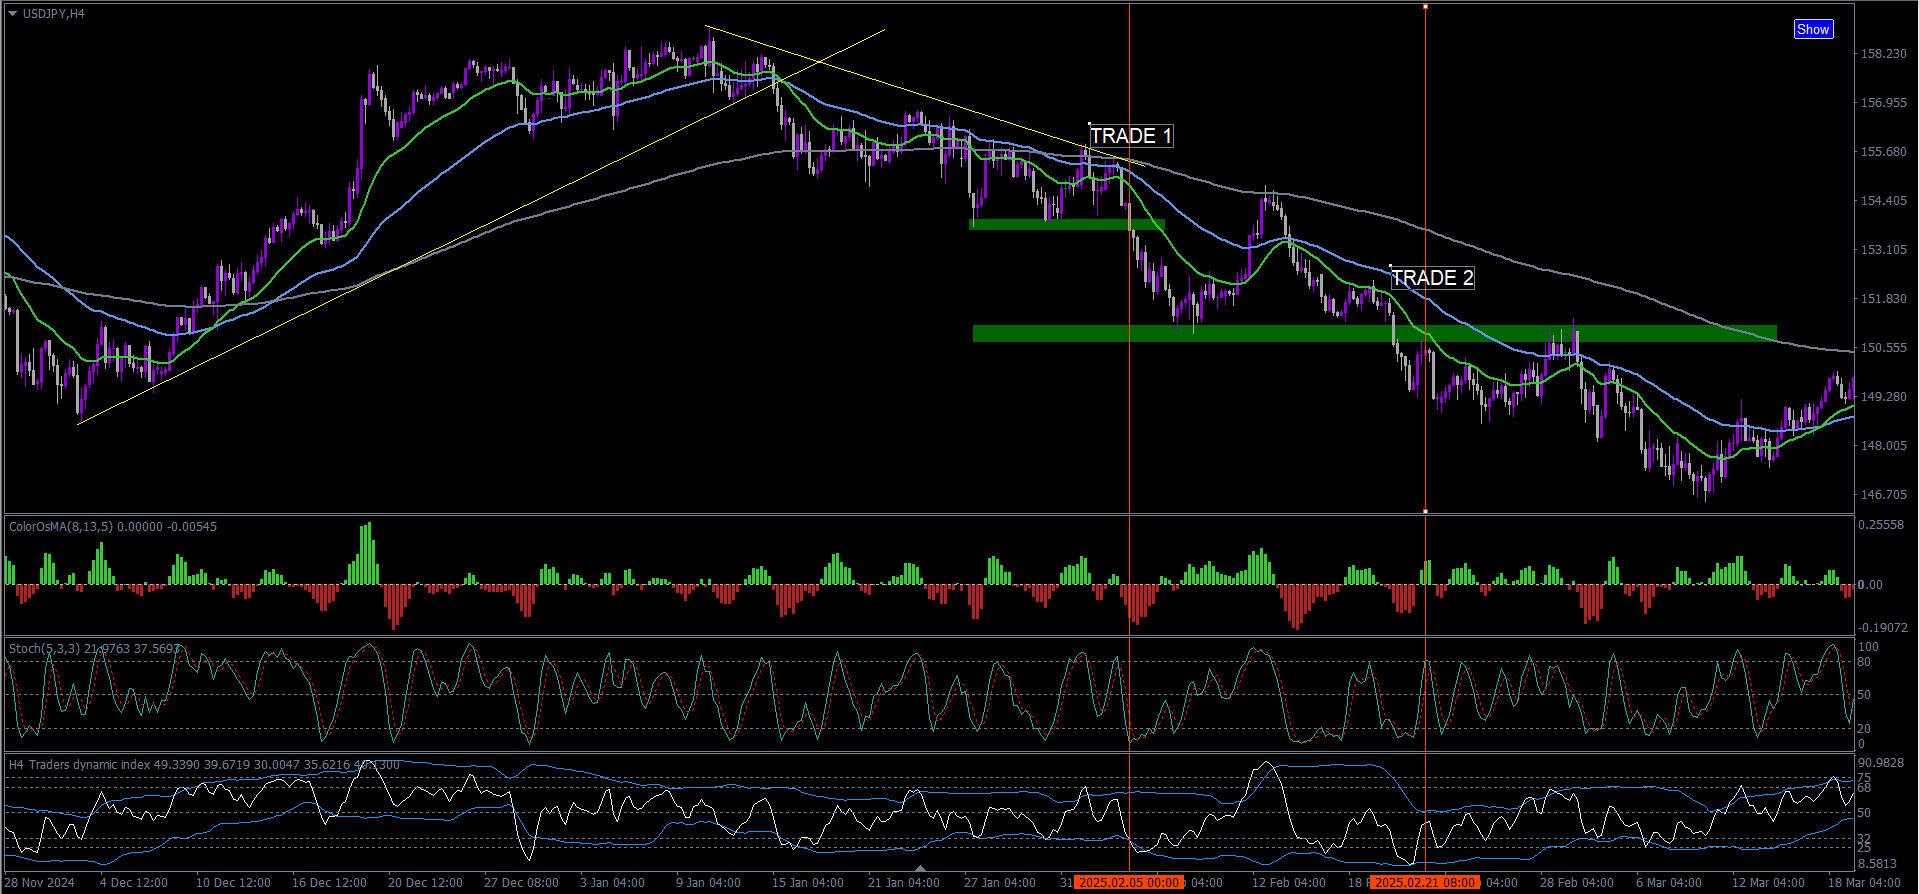
Next screenshot shows two trades, one and two which I will explain in greater detail. They are the classic break and retest types of trade which I look for. Both of these are with the trend, moving averagers in correct order on the next higher time frame and the next lower time frame.
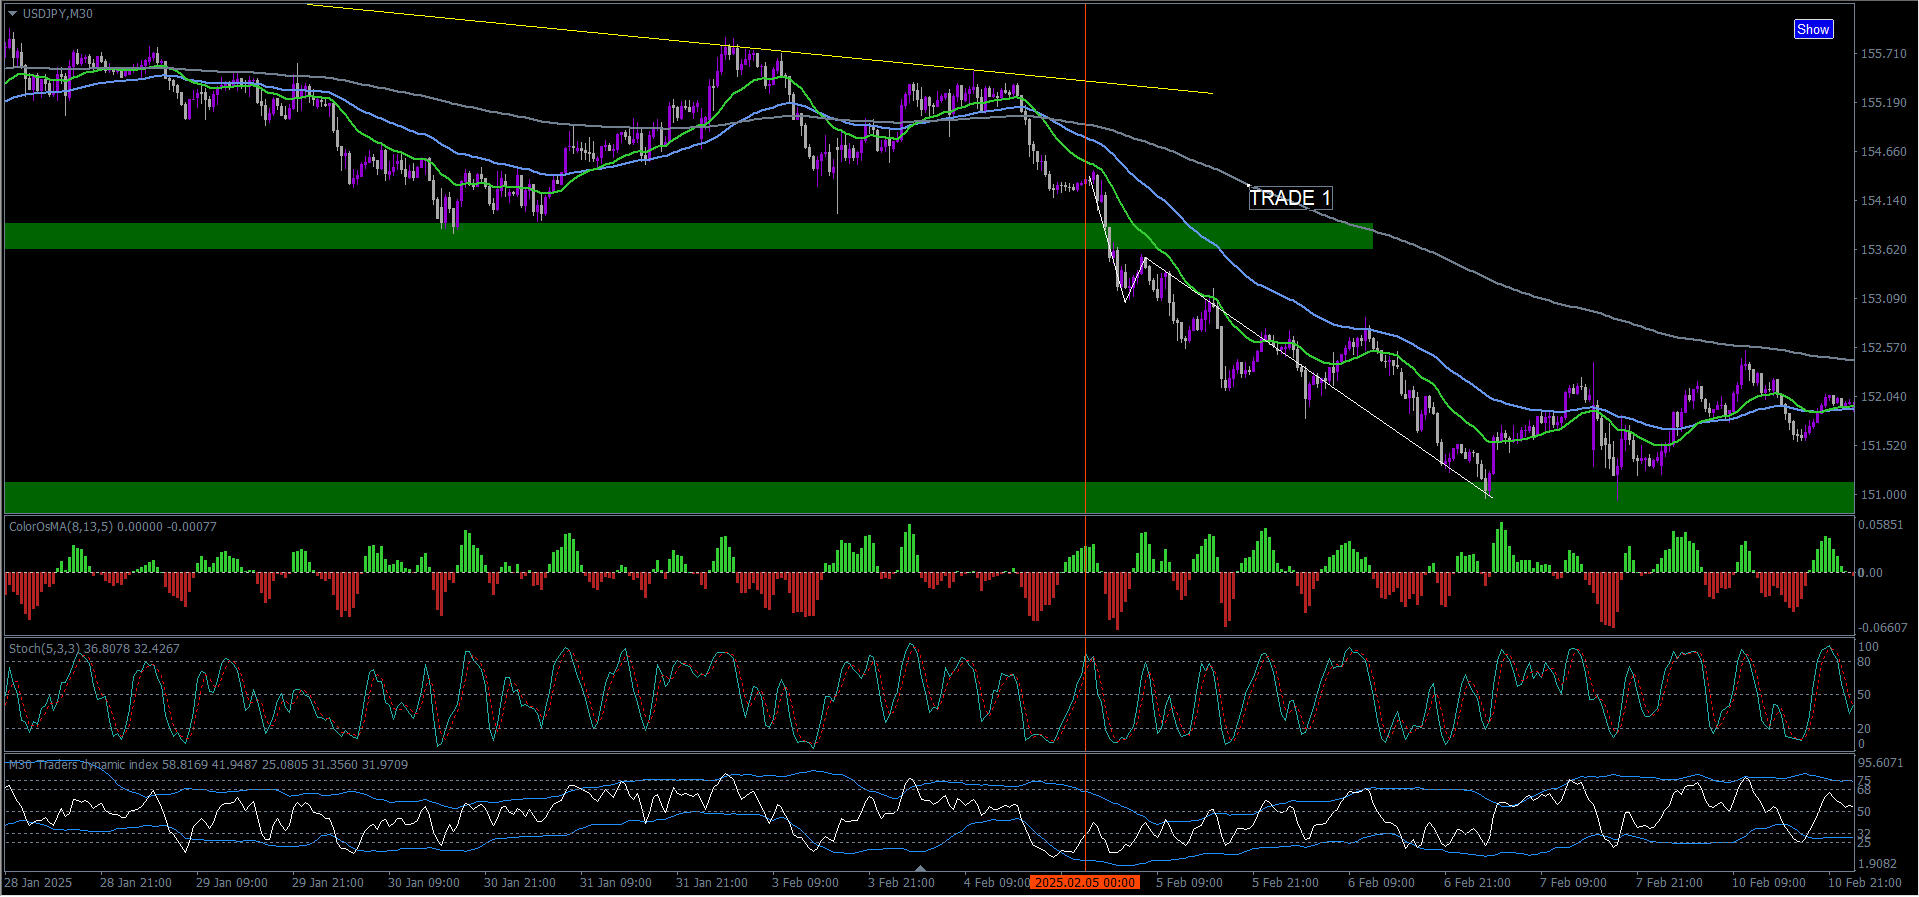
Trade 1 doesn't really look like the classic break and retest, but some times the price is moving fast and never seems to come back. In this situation I like to go to a lower time frame.
Form the 4 hours I went down to the 30 minutes time frame, here the retest is much clearer. You can also get a smaller stop loss and a larger take profit on a lower time frame.
Add-on CTDI Shark Fin -
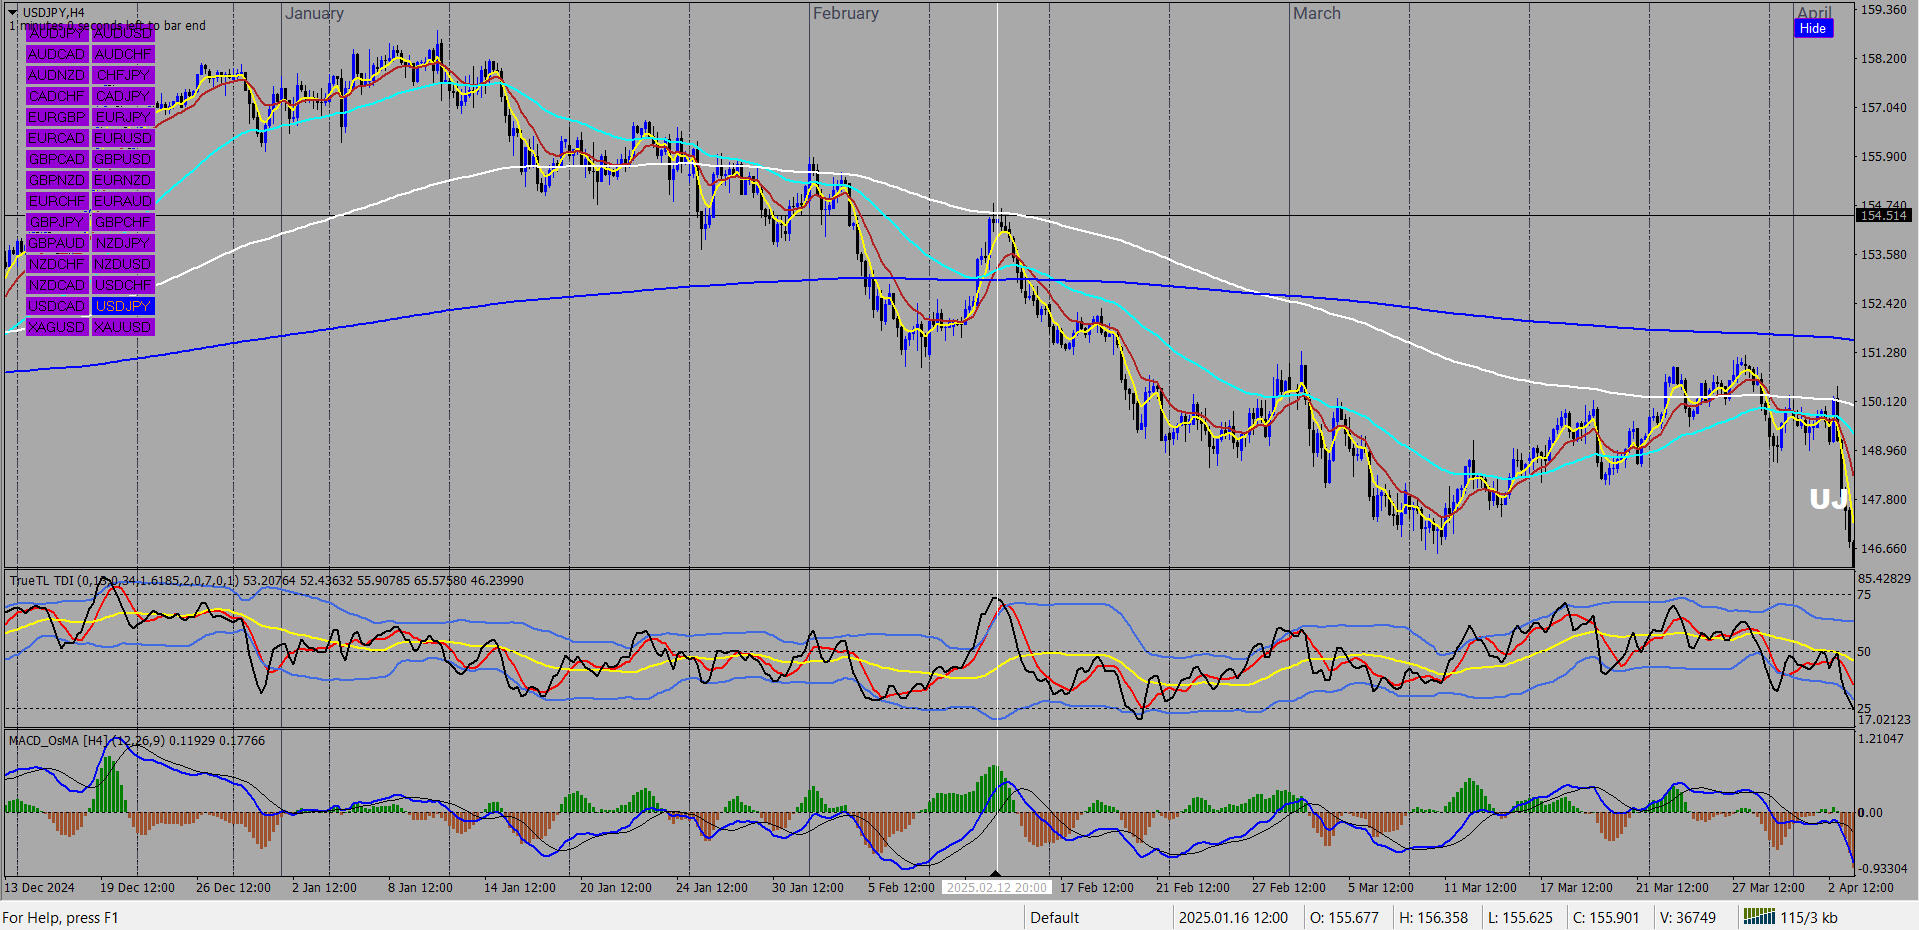
Google TDI Shark Fin. Below we see a sell trade. We have a TDI shark fin with hidden divergence. An extra strong confluence. You can also use just the TDI shark fin on it's own.
Moving averages are in order on this time frame and the one above (Daily).
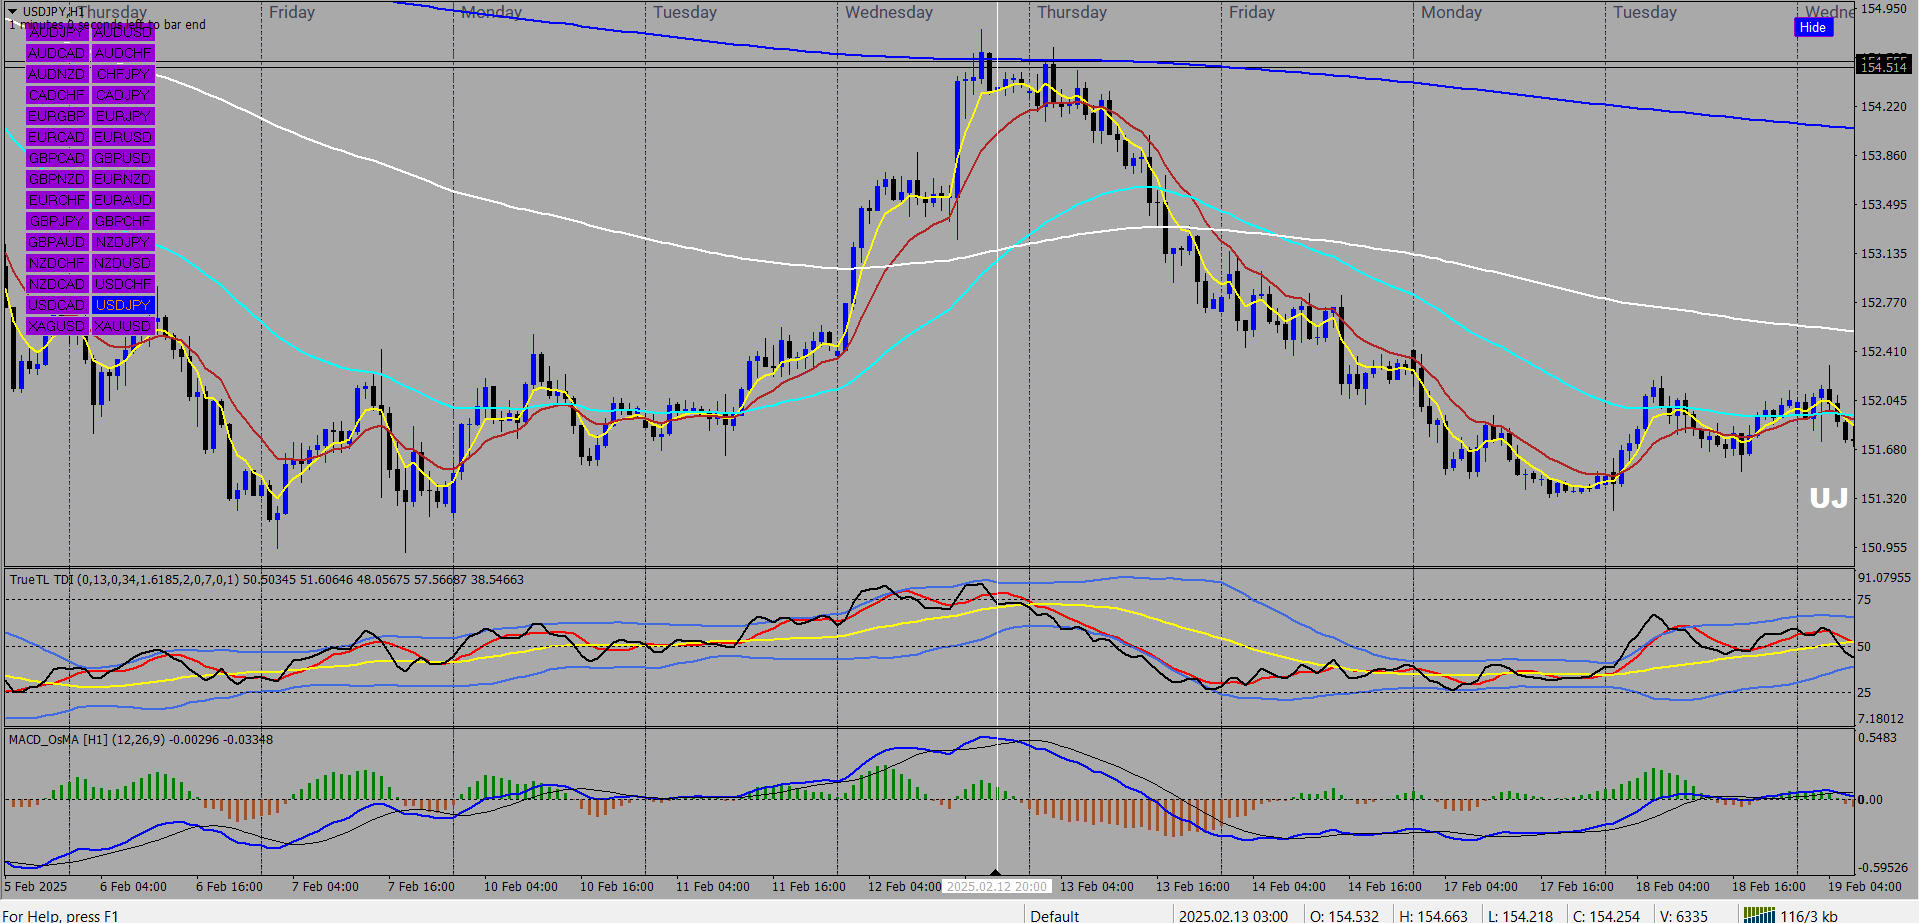
As usual, we go down to a lower time frame to optimize our entry. On the H1 we see an M pattern at the 800 EMA (which is the 200 on the H4). Regular divergence on the MACD.
Entry criteria:-
- Close below the red 13 EMA.
- TDI market baseline bounce.
- After regular divergence.
- Trendline break.
- Break of structure.
- etc.
In summary:-
The 3 additional entry methods are strategies in themselves but also a good add on to the main strategy and certainly provides more trades.